How to play Rates of Reaction Graphs
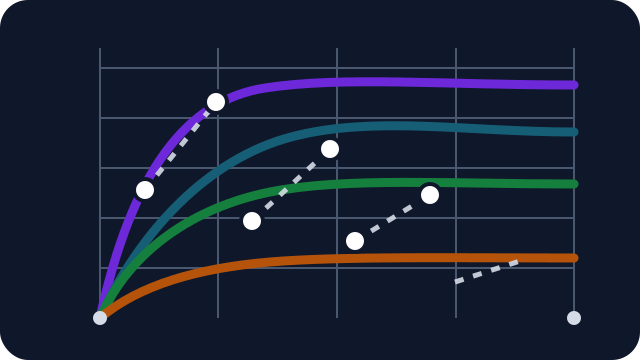
Rates of Reaction Graphs is a free GCSE chemistry game about reading rates of reaction from a graph. Each graph shows how much product a reaction has made over time. The product is either a mass in grams or a volume of gas in cm³.
In the first questions, the curve has two marked points, with their time and amount printed beside them. You work out the mean rate between the two points and pick it from four answers. Every answer carries its unit, g/s or cm³/s.
From question 8, four reactions share one graph. Each has two marked points, and you pick the reaction with the highest mean rate between its own points. Tick the harder start and the game skips ahead. After three mean rate questions, each graph has a tangent drawn at one point, and you use it to find the rate at that moment.
You get 40 seconds per question and 10 points for each right answer. After every question, the game shows the full working. On a keyboard, press 1 to 4 to answer and Enter to go on. Practice mode turns the clock off for the round.
The science behind rates of reaction
The rate of a reaction tells you how fast it makes products or uses up reactants. You measure it by timing how much product forms, often as a mass in grams or a volume of gas in cm³. Then mean rate = amount of product formed ÷ time taken. The unit is g/s for a mass and cm³/s for a volume.
For example, at 3 s a gas syringe holds 31.5 cm³ of gas. At 6 s, it holds 54 cm³. The gas made in that time is 54 − 31.5 = 22.5 cm³, and the time taken is 6 − 3 = 3 s. So the mean rate is 22.5 ÷ 3 = 7.5 cm³/s.
On a graph of product against time, a steeper curve means a faster reaction. The curve is steepest at the start and then bends over. Particles only react when they collide with enough energy. As the reactants get used up, collisions happen less often, so the reaction slows. When the curve goes flat, the reaction has stopped.
Because the curve bends, the rate changes from moment to moment. To find the rate at one moment, you draw a tangent. A tangent is a straight line that just touches the curve at that point. Its gradient, meaning its slope, is the rate at that moment. You find it by dividing how far the line rises by how far it runs across.
AQA 8462 covers this in 4.6.1.1 and AQA 8464 in 5.6.1.1. On AQA, every student draws tangents, but working out the gradient of a tangent is Higher Tier only. Edexcel 1CH0 and 1SC0 cover rate graphs in point 7.5. OCR Gateway J248 covers them in C5.2b, and OCR Twenty First Century J258 in C6.2.
Tips for reading rate of reaction graphs
- Subtract first. Take the amount at point 1 away from the amount at point 2, then do the same for the times.
- Divide the change in amount by the change in time. Stopping at the change in amount is a common slip.
- Use only the time between the two points. Dividing by the time for the whole reaction gives an answer that is too small.
- In the example above, 54 ÷ 3 = 18 cm³/s is wrong. It uses the total gas made, when it needs the gas made between the points.
- When you compare reactions, look at how steep each dashed line is. The steepest line has the highest mean rate, even if its reaction makes less product overall.
For a tangent, pick two points far apart on the line itself. A longer rise and run makes your reading more accurate. Physics uses the same skill, so Motion Graphs gives you more practice at reading gradients.
Use Rates of Reaction Graphs in the classroom
The game suits Years 9 to 11 in the lesson after a rates practical, such as collecting gas in a syringe. Pupils have just seen a curve made from their own results, so the graphs in the game look familiar.
Try it as a plenary. Show one question on the board and ask the class which wrong answer each mistake would give. Then let pairs play a round and write down each rate with its unit. Higher Tier groups can play the harder start to practise tangents before an exam. Foundation groups can stay on the normal round, which stops at mean rates and comparing reactions.
The page for teachers explains how the games work in class, with nothing for pupils to sign up for.
Similar games
Rate graphs also turn up in biology: Photosynthesis Lab asks you to find the limiting factor from a rate graph. For more chemistry, Bonding Blitz asks you to name the type of bond in each substance. The chemistry games page and the full list of games have the rest.
Questions about rates of reaction
Here are answers to common questions about rate of reaction graphs.
How do you calculate the mean rate of reaction from a graph?
Read the amount of product at two times. Take the smaller amount from the larger one, then divide by the time between the two readings. Give the answer with a unit such as g/s or cm³/s.
What are the units for rate of reaction?
If you measure mass in grams, the rate is in g/s. If you measure a volume of gas in cm³, the rate is in cm³/s. On AQA, Higher Tier students also use mol/s.
Is working out the gradient of a tangent Higher Tier?
On AQA, yes. All AQA students draw a tangent and use its slope as a measure of rate, but only the Higher Tier works out the gradient as a number. In this game, tangent questions only appear with the harder start.
Why does a rate of reaction graph level off?
The reaction slows as the reactants get used up, because particles collide less often. When one reactant runs out, no more product forms, so the line goes flat.